

Publications
https://scholar.google.com/citationshl=en&user=5OwEySoAAAAJ&view_op=list_works&sortby=pubdate
Research Vignettes
 Gene-by-Environment Interactions (GxE)
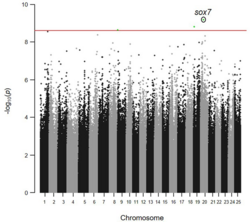
[Example: Balik-Meisner et al (2018) Environmental Health Perspectives]
Modern societies are exposed to vast numbers of potentially hazardous chemicals. Despite demonstrated linkages between chemical exposure and severe health effects, there are limited, often conflicting, data on how adverse health effects of exposure differ across individuals. We tested the hypothesis that population variability in response to certain chemicals could elucidate a role for gene–environment interactions (GxE) in differential susceptibility. High-throughput screening (HTS) data on thousands of chemicals in genetically heterogeneous zebrafish were leveraged to identify a candidate chemical (Abamectin) with response patterns indicative of population susceptibility differences. We tested the prediction by generating genome-wide sequence data for 276 individual zebrafish displaying susceptible (Affected) vs. resistant (Unaffected) phenotypes following identical chemical exposure. We found GxE associated with differential susceptibility in the sox7 promoter region and then confirmed gene expression differences between phenotypic response classes. The results for Abamectin in zebrafish demonstrate that GxE associated with naturally occurring, population genetic variation play a significant role in mediating individual response to chemical exposure.
 Geospatial Data Integration and Machine Learning
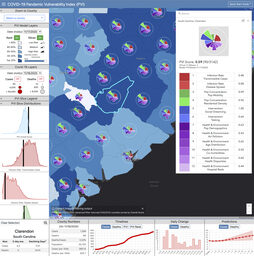
[Example: Marvel et al (2020) Environmental Health Perspectives]
Expert groups have coalesced around a roadmap to address the current COVID-19 pandemic centered on social distancing, monitoring case counts and health care capacity, and, eventually, moving to pharmaceutical interventions. However, responsibility for navigating the pandemic response falls largely on state and local officials. To make equitable decisions on allocating resources, caring for vulnerable subpopulations, and implementing local- and state-level interventions, access to current pandemic data and key vulnerabilities at the community level are essential. Although numerous predictive models and interactive monitoring applications have been developed using pandemic-related data sets, their capacity to aid in dynamic, community-level decision-making is limited. We developed the interactive COVID-19 Pandemic Vulnerability Index (PVI) Dashboard (https://covid19pvi.niehs.nih.gov/) to address this need by presenting a visual synthesis of dynamic information at the county level to monitor disease trajectories, communicate local vulnerabilities, forecast key outcomes, and guide informed responses.
 High-Throughput Screening (HTS) of Environmental Chemicals
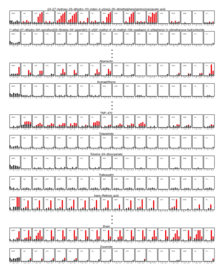
[Example: Truong et al (2014) Toxicological Sciences]
There are tens of thousands of man-made chemicals in the environment; the inherent safety of most of these chemicals is not known. Relevant biological platforms and new computational tools are needed to prioritize testing of chemicals with limited human health hazard information. We describe an experimental design for high-throughput characterization of multidimensional in vivo effects with the power to evaluate trends relating to commonly cited chemical predictors. We evaluated all 1060 unique U.S. EPA ToxCast phase 1 and 2 compounds using the embryonic zebrafish and found that 487 induced significant adverse biological responses. The utilization of 18 simultaneously measured endpoints means that the entire system serves as a robust biological sensor for chemical hazard. The experimental design enabled us to describe global patterns of variation across tested compounds, evaluate the concordance of the available in vitro and in vivo phase 1 data with this study, highlight specific mechanisms/value-added/novel biology related to notochord development, and demonstrate that the developmental zebrafish detects adverse responses that would be missed by less comprehensive testing strategies.
 Statistical Methods Development & Visual Analytics
[Example: Reif et al (2010) Environmental Health Perspectives]
The prioritization of chemicals for toxicity testing is a primary goal of the U.S. Environmental Protection Agency (EPA) ToxCast™ program. Phase I of ToxCast used a battery of 467 in vitro, high-throughput screening assays to assess 309 environmental chemicals. One important mode of action leading to toxicity is endocrine disruption, and the U.S. EPA's Endocrine Disruptor Screening Program (EDSP) has been charged with screening pesticide chemicals and environmental contaminants for their potential to affect the endocrine systems of humans and wildlife. The goal of this study was to develop a flexible method to facilitate the rational prioritization of chemicals for further evaluation and demonstrate its application as a candidate decision-support tool for EDSP. Focusing on estrogen, androgen, and thyroid pathways, we defined putative endocrine profiles and derived a relative rank or score for the entire ToxCast library of 309 unique chemicals. Effects on other nuclear receptors and xenobiotic metabolizing enzymes were also considered, as were pertinent chemical descriptors and pathways relevant to endocrine-mediated signaling. Combining multiple data sources into an overall, weight-of-evidence Toxicological Priority Index (ToxPi) score for prioritizing further chemical testing resulted in more robust conclusions than any single data source taken alone. Incorporating data from in vitro assays, chemical descriptors, and biological pathways in this prioritization schema provided a flexible, comprehensive visualization and ranking of each chemical's potential endocrine activity. Importantly, ToxPi profiles provide a transparent visualization of the relative contribution of all information sources to an overall priority ranking. The method developed here is readily adaptable to diverse chemical prioritization tasks.

Software
[Example: Marvel et al (2018) BMC Bioinformatics]
Drawing integrated conclusions from diverse source data requires synthesis across multiple types of information. The ToxPi (Toxicological Prioritization Index) is an analytical framework that was developed to enable integration of multiple sources of evidence by transforming data into integrated, visual profiles. Methodological improvements have advanced ToxPi and expanded its applicability, necessitating a new, consolidated software platform to provide functionality, while preserving flexibility for future updates. We detail the implementation of a new graphical user interface for ToxPi (Toxicological Prioritization Index) that provides interactive visualization, analysis, reporting, and portability. The interface is deployed as a stand-alone, platform-independent Java application, with a modular design to accommodate inclusion of future analytics. The new ToxPi interface introduces several features, from flexible data import formats (including legacy formats that permit backward compatibility) to similarity-based clustering to options for high-resolution graphical output. We present the new ToxPi interface for dynamic exploration, visualization, and sharing of integrated data models. The ToxPi interface is freely-available as a single compressed download that includes the main Java executable, all libraries, example data files, and a complete user manual from https://toxpi.org.